
With Kubernetes' ability to scale rapidly, application power is greatly improved with a few simple steps. But with many microservices heavily relying on data from databases, it is no surprise that databases can get a severe beating from your application when you scale. In this blog/lab, we are going to set up a very basic infrastructure and use load testing to stress the database, to learn how to use the tools to improve the performance of the database.
In this lab, we will focus on the Serverless variant, the DTU-based database service. There is, however, an alternative: the vCore model. This model would fit your needs if you need different storage requirements because you can set the storage and compute requirements independently of each other. With the DTU-based model, the storage is tightly coupled to the SKU you set.
Goals
- Understanding DTU
- Set up a lab
- Load insights
- Cause analysis
- Improving performance
Some theory before we start scaling
A very common database model is the DTU-based model. DTU stands for Database Transaction Unit and indicates the amount of performance you can expect. There are basically three tiers. Basic, only really fit for demo and try-out purposes. Standard, for small to medium-sized workloads. And premium, for high-performance workloads.
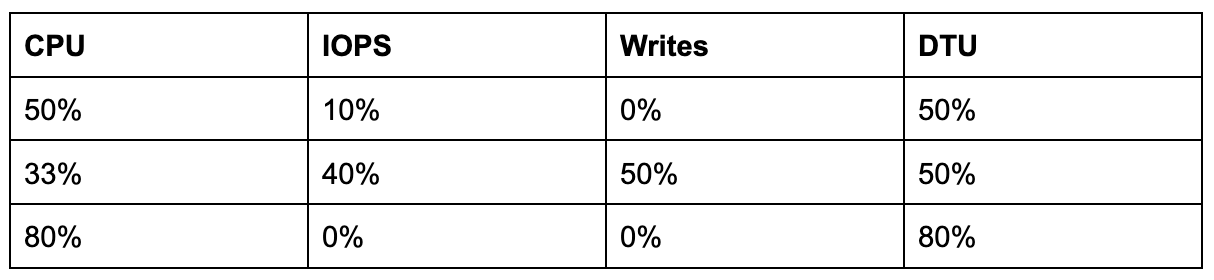
This DTU model is based on a number of metrics. It is based on the amount of CPU, IOPS and log writes from a single database. The maximum of any of these is the actual DTU percentage.
So if you use all the CPU, but very little IOPS you are using 100% DTU.
If you use 0% CPU, 100% IOPS, you are also using 100% DTU. So 100% the same number, not the same cause or performance. It is therefore important to realize that those 100%'s are not the same.
This lab will explain these numbers and try to understand what is happening and how we can improve the overall performance.
Setting up
In order to do some proper labbing, we have to create the right components we can stress and investigate.
- Azure components (app service, SQL database)
- Test application
- Load testing
1. Set up Azure infra
You can use the following Terraform resources to quickly spin up all the necessary services.
You can find the files in our public repository.
- Clone the repo
- Run 'az login'
- run az account set -s .. if you have multiple subscriptions and want to set the correct scope
- cd to the terraform-code folder
- Run 'Terraform init' / plan / apply to generate the infra.
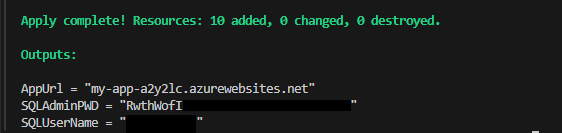
- When the apply is complete, you are presented with important details like below.
The components are an App Service, Azure SQL Server with a single database and an alert email setup.
2. Test application
For this demo, I have pulled a very simple web application from GitHub.
This application can list/add and edit a list of to do’s. It is an app service that is backed by an Azure SQL database. So a website we can stress, and a database that will get hit hard.
The app is called app-service-web-tutorial-dotnet-sqldatabase and can be found on GitHub.
While this application is a good start, it needs two minor updates to make it work in this lab.
- Create a web.config that holds the database connection string
You can find an example in this demo repo. Make sure you update the server name, database name, username and password on line 12.
- Disable ‘ValidateAntiForgeryToken’ in the ToDosController.cs, line 51.
For the sake of demo purposes, we can disable this validation. This is only done to simplify the load testing. Enabled by default, it would require the JMeter test to read and resubmit a verification cookie to be validated. This is a good hammer/spam-prevention mechanic. When disabled, there is no need to read and resubmit the validation cookie, greatly simplifying our load test. This anti-hammering protection has no value for this test and is disabled. This is, of course, only for demo and testing purposes. For real-world scenarios, I would advise following these instructions.
Now build the application and verify if it works locally (you need to add your private IP to the firewall of the Azure SQL if you do).
Publish the application by choosing ‘Build’ in the top menu, and choosing ‘Publish’. You can now select an Azure app service as a target, and choose your app name in the tf-resource-group resource group. You can skip the deployment slot option.
Now publish the application, now you are a few seconds away from launching the application.
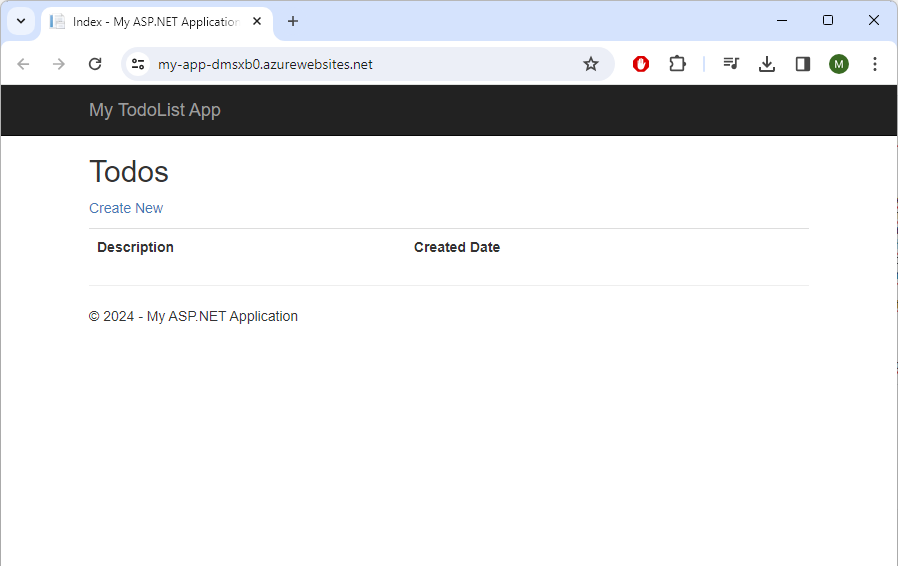
You should now be able to view your application like so.
3. Start testing
Now the fun bit, we have set up the application and can start load testing.
- Fire up JMeter
- Obtain the JMX file (from the repo), and update the URL’s
- You can use the UI and review all HTTP Requests
- or open the JMX file in a text editor and find and replace the YOURAPPNAMEHERE with your app name.
- Review the Thread Groups
- Start the test!
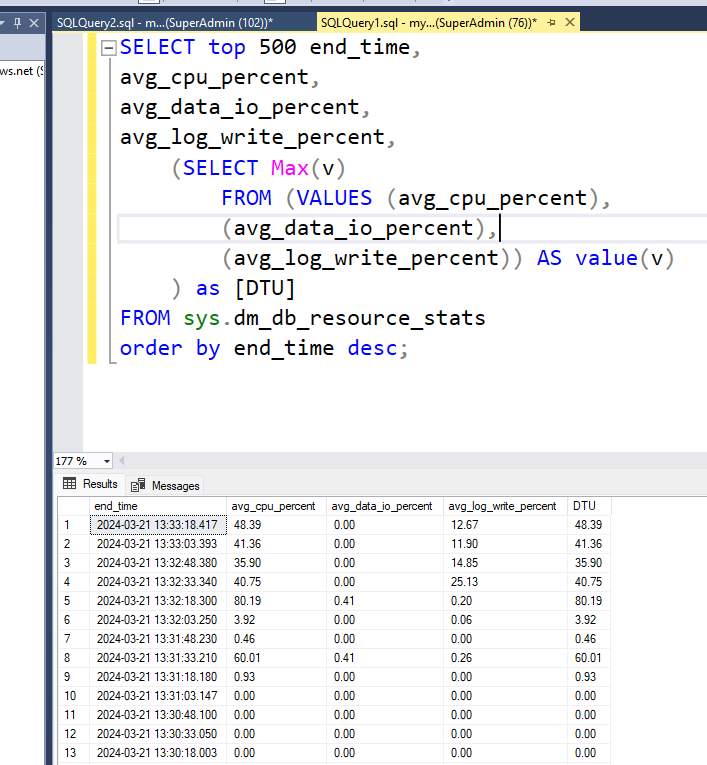
The test is designed to run forever, so can run it and put it away and look at the Azure SQL database metrics. Like for example, run the following query against the database. You can use Microsoft SQL Management Studio for that.
Did you know, you can run the following query in your Azure database, and get the current DTU numbers? This is the same source of data that is used by the Azure backend. 🙂
You can find the query in the repo.
You can also run this query on a schedule and feed it into your favourite metrics tool.
These numbers can also give you an insight into what is causing the DTU.
Be advised, that you are reading percentages, so if you scale expect the percentages to drop.
Testing
So for our example. We know what is stressing our application. But you can try and fiddle with the thread groups and see if you can get the DTU numbers dancing. If you increase the thread group that inserts the new to-do items, you should see the data IO going up.
Do note, since our application is extremely simple you might need to upgrade the app service to allow for the extra traffic towards the database. :) You can scale horizontally (add more workers) or vertically (go to the premium plan). Either way is fine for this demo.
Now that we have gathered the numbers, we can start digesting them. The following:
High CPU usage
- Inefficient queries, like using poor wildcard statements
- High demand in retrieval of data
- Highly complex queries, like unions, multi-joins
High Data IO usage
- Inefficiënt reads, like 'select * from..'
- Inefficient internal statistics
- Lack of proper indexes
- Full table scans
High log Write usage
- High inserts
- High updates
- Waiting on replication partner
This is of course not a complete list, but should give you some direction on what is stressing your database. If for example, you see CPU and data IO being heavily used, consider switching to the vCore model. Since that model allows you to decouple them and scale more efficiently.
Now what?
The following services can be used to assist you in finding the cause of the high loads. You can all find this on the menu blade in the Azure portal if you open up your created database.
- Set up alerts
You can quite easily set up alerts from Azure monitor to notify when the number of DTUs are exhausted. This might also give you some insights in load patterns. You can find an example alert in the Terraform code. Refer to the alert group.tf file in the repo.
You can actually set the alerts on Server level, so even a newly created database will get the same alert setting.
- Placement of SQL Indexes
While the inner workings of proper indexes are out of scope for this blog, an index can provide a pointer of where the requested item resides on your storage medium. And thus can improve performance greatly when the correct data can be fetched quickly. Please find these background articles to learn more about indexes and placement:
Microsoft SQL server index design guide
Use the Index
The ideal indexing strategy for SQL Server
- Basic database maintenance
While it might sound obvious. Every database needs maintenance. Two main things to look out for are fragmented indexes and out-of-data internal statistics. Both of which can easily be tightened up by this simple automation job. This automation runbook runs a re-index of all indexes (if required), and updates the internal statistics.
Internal statistics are input numbers for the query plan to determine how to run the query. Simply put, out-of-date statistics might guide the query optimizer in the wrong direction for query execution. Please find the repo for this runbook in our repo.
- Query performance insights
Performance insights provide an overview of the pressure of the queries applied and how those queries affect the load on CPU, data IO or log writes. You can filter and sort out data, and even read the exact query that is run against the database.
Be cautious, however, an offending query might also be a victim of another query so keep digging. You might be looking at a query that is actually slowed down by other queries. So don’t stop at the first query you find.
- Automatic tuning
Is an option you can enable that can create indexes (or drop them) automatically. It can optimize query plans and can verify if the change is positive or negative and adjust accordingly. You can enable this option from within the database with the following SQL query.
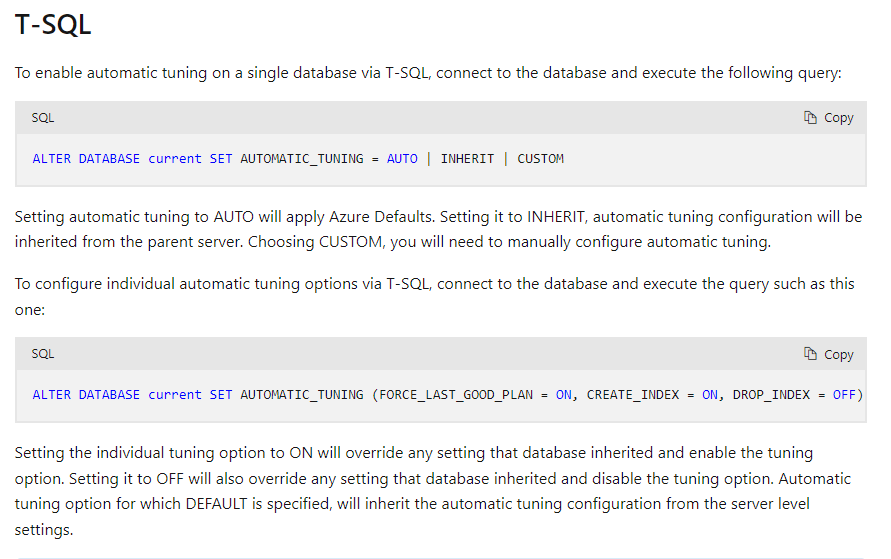
Learn more about this service here.
This service is not advised if you have a database-first strategy in your application. Meaning that the structure of your database is verified - and updated - on application launch. So if this service created an index the application is not aware of that on the next deployment. If you do want any changes applied, use the performance recommendation service instead. You can however take the advice and update your database structure accordingly. The advice will drop when the index is created since the database is periodically checked.
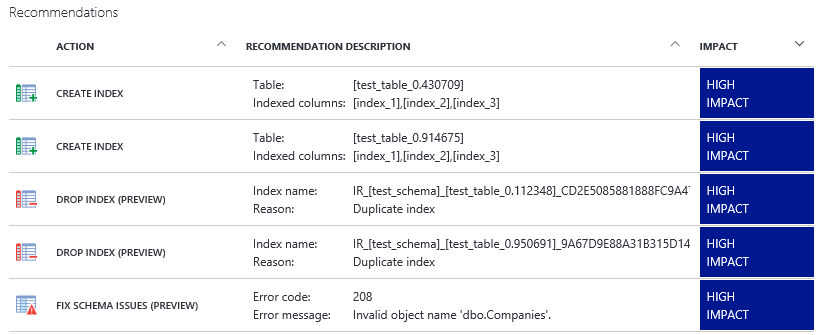
- Performance recommendations
Needs quite a bit of data, but can advise on the placement of indexes and such. In essence, it works the same as the automatic tuning service, but it only gives advice. So you can assess each piece of advice and implement it accordingly.
- Peak shaving
With the knowledge gained from the query performance insights, you can try and move the offending queries outside peak hours. For example, the creation of custom numbers (SSN, bank accounts and such) creates too much of a load on the database. Because it needs to conform to certain business logic which consumes CPU load. Create a job that creates a pool of numbers ready to grab ‘off the shelf’ during peak hours. Moving the load away to off-hours.
- Scaling
Scaling within the tier of your database (Standard, Premium) is done nearly instantly. So if the load is consistent and keeps increasing. It might not be a bad idea to do a quick +1 on the SKU.
Sometimes a short burst in scale is often far cheaper than the investigation of what / when / how. While it is a short-term solution, it can buy you enough time to properly investigate the root cause of the issues. It is always a time vs money conundrum. But why not both? You now have some time, insights, and tools to move forward.
- Elastic pool
If you have a set of databases and each with its peaks and valleys at random moments. And you want to give each database enough performance. It might be a good idea to move the database to an elastic pool. You move the database from an individual SKU to a pool-based SKU. So the set of databases can share performance between them. This way databases can peak higher for short bursts of time with a high ceiling.
Let's say you have 10 databases all set to Standard service tier at S2 (50DTU). None of the databases can peak above the 50 DTU because it is their individual limit. But if you set them into an elastic pool of 200DTU each of them can have high peaks if they peak at different times. You have more performance at a lower cost (since 200DTU elastic pool is cheaper than 5*50DTU single databases).
In a way, an elastic pool is more like a classic SQL Server, where databases share the performance of the actual server (CPU, memory, IOPS). The benefit is that an elastic pool can limit a single database to say 80-90% of the pool, so it is less likely to squeeze the performance of other databases in the pool.
- Mix and match
You can mix an elastic pool with some databases, a standard-size database and a premium on the same server. If your workload requires it, you can make it work. :)
Final thoughts
So to summarize
- Be informed, set up the proper alerts
- Do proper maintenance
- Investigate the load and find the culprits
- Scaling can be your friend
- Understand it is an evolving process, repeat it occasionally
Now you have a better understanding of how a database can be tuned and optimized.
Don't forget to run 'Terraform destroy' to remove all the created assets.